Running ONTraC on Stereo-seq dataset
Notes
This notebook will show you the process of running ONTraC on stereo-seq data.
We assume that you have installed ONTraC according to the Installation Tutorial and open this notebook using installed Python kernel (Python 3.11 (ONTraC)).
Running ONTraC on Stereo-seq data
If your default shell is not Bash, please adjust this code.
ONTraC will run on CPU if CUDA is not available.
Download stereo_input.csv from the Zenodo Dataset repository under preprocessing directory.
%%bash

source ~/.bash_profile
conda activate ONTraC
ONTraC --meta-input data/stereo_seq_brain/original_data.csv --NN-dir output/stereo_seq_NN --GNN-dir output/stereo_seq_GNN --NT-dir output/stereo_seq_NT --device cuda -s 42 --lr 0.03 --hidden-feats 4 -k 6 --modularity-loss-weight 0.3 --regularization-loss-weight 0.1 --purity-loss-weight 300 --beta 0.03 2>&1 | tee log/stereo_seq.log
Results visualization
Please see the Visualiztion Tutorial for details.
Install required packages
If you default sh is not bash, please adjust this code
%%bash

source ~/.bash_profile
conda activate ONTraC

pip install ONTraC[analysis]
Loading results
from ONTraC.analysis.data import AnaData
from optparse import Values

options = Values()
options.NN_dir = 'simulation_NN'
options.GNN_dir = 'simulation_GNN'
options.NT_dir = 'simulation_NT'
options.log = 'simulation.log'
options.reverse = True  # Set it to False if you don't want reverse NT score
options.output = None  # We save the output figure by our self here
ana_data = AnaData(options)
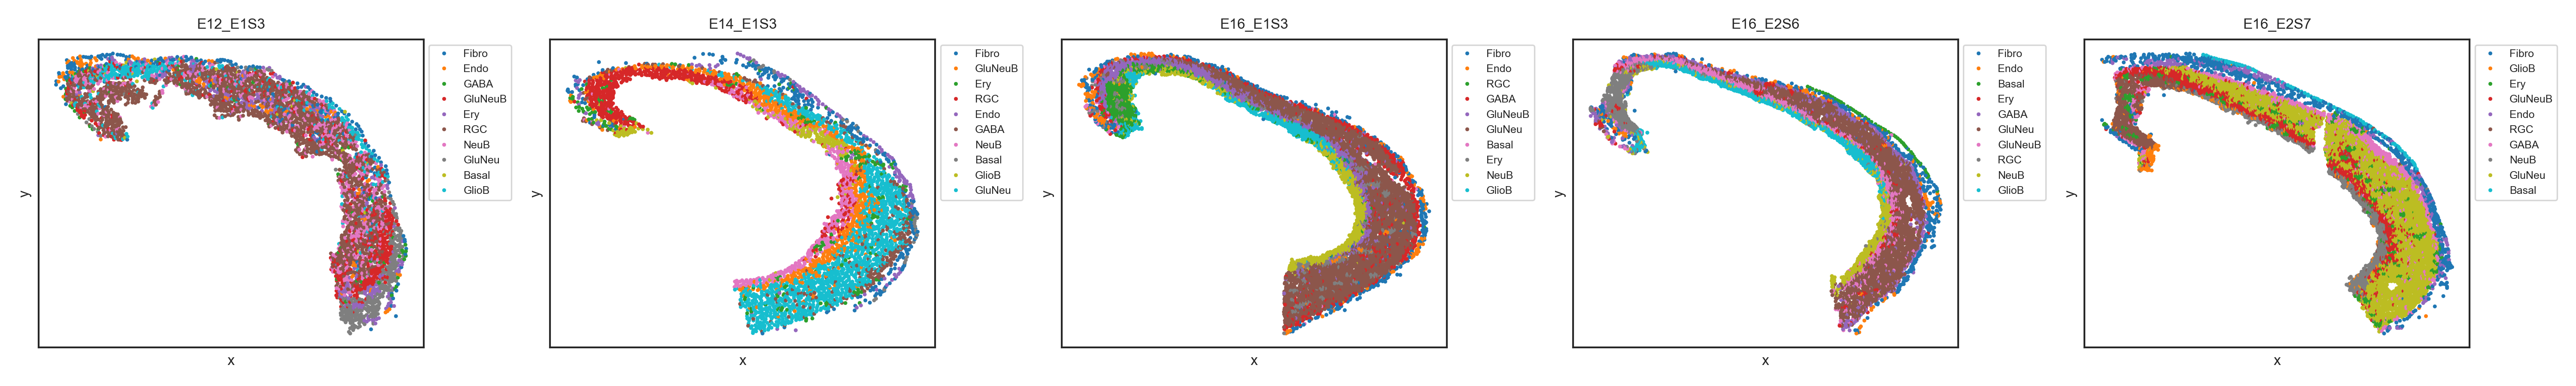
Spatial cell type distribution
from ONTraC.analysis.cell_type import plot_spatial_cell_type_distribution_dataset_from_anadata

fig, axes = plot_spatial_cell_type_distribution_dataset_from_anadata(ana_data = ana_data,
                                                                     hue_order = ['RGC', 'GlioB', 'NeuB', 'GluNeuB', 'GluNeu', 'GABA', 'Ery', 'Endo', 'Fibro', 'Basal'])

for ax in axes:
    # ax.set_aspect('equal', 'box')  # uncomment this line if you want set the x and y axis with same scaling
    # ax.set_xticks([])  # uncomment this line if you don't want to show x coordinates
    # ax.set_yticks([]) # uncomment this line if you don't want to show y coordinates
    pass

fig.tight_layout()
fig.savefig('spatial_cell_type.png', dpi=300)
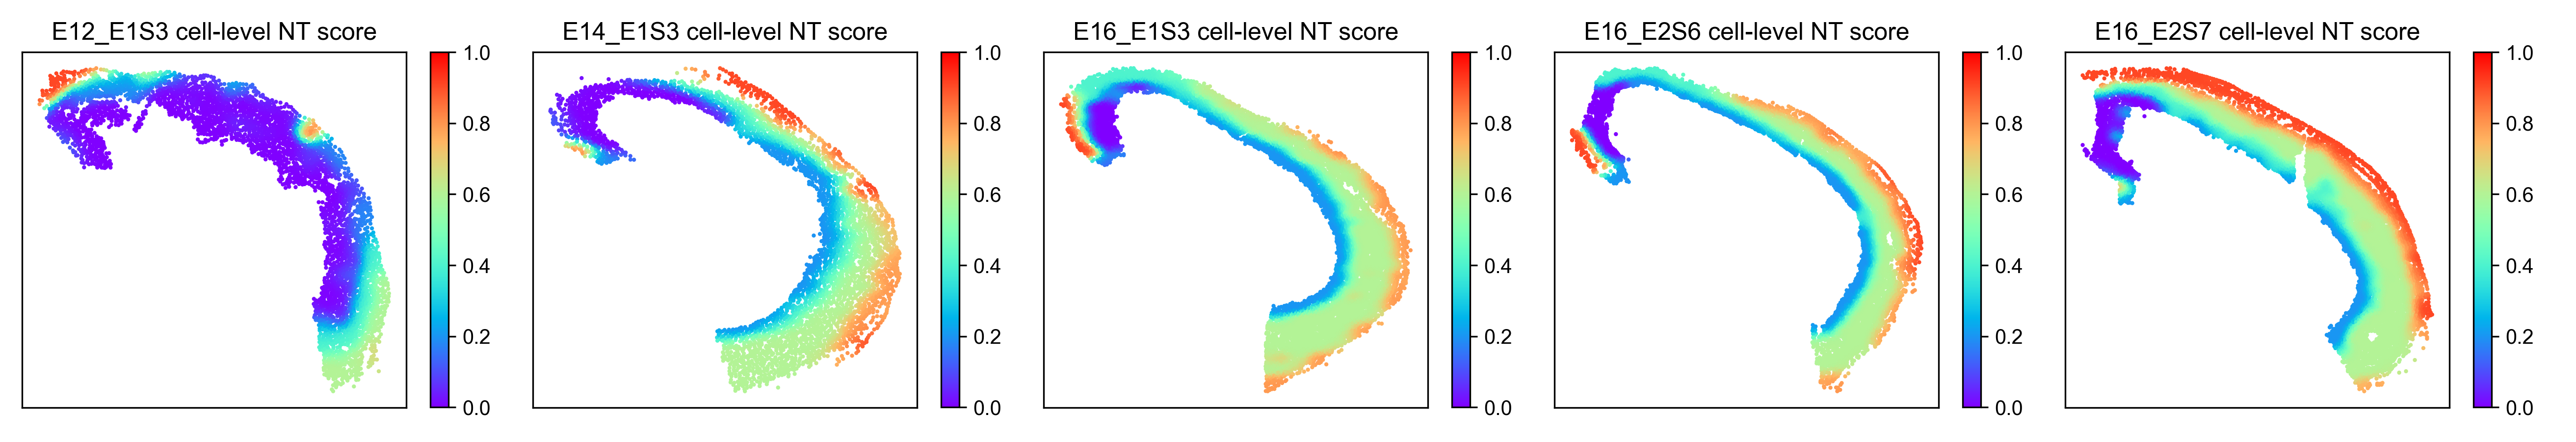
Cell-level NT score spatial distribution
from ONTraC.analysis.spatial import plot_cell_NT_score_dataset_from_anadata

fig, ax = plot_cell_NT_score_dataset_from_anadata(ana_data=ana_data)
fig.savefig('cell_level_NT_score.png', dpi=300)